Here's the spreadsheet with data for all neighborhoods and the A/B data
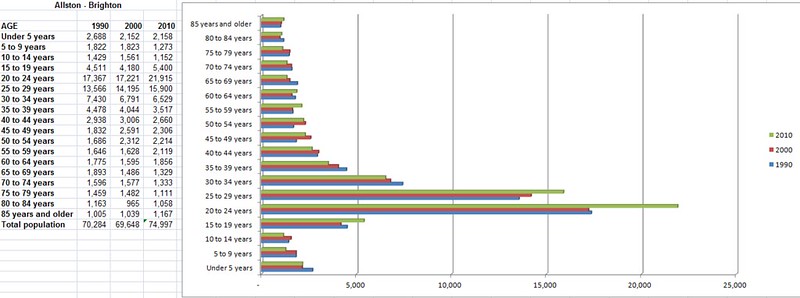
Here's how the # of kids 14 & under has steadily dropped in the last 20 years
1990: 5,939 (8.5% of total)
2000: 5,536 (7.9% of total)
2010: 4,583 (6.1% of total)
More than 1/2 of Allston and Brighton residents are in their 20s
Fascinating chart. Thanks for sharing! it's crucial for folks to understand the changing demographics of our neighborhood, especially those of us involved in community work!
ReplyDeletethis is a really powerful chart. it shows you how much diversity this neighborhood loses as it skews to one age group.
ReplyDelete